“Earnings don’t move the overall market; it’s the Federal Reserve Board… focus on the central banks, and focus on the movement of liquidity… most people in the market are looking for earnings and conventional measures. It’s liquidity that moves markets.” – Stan Druckenmiller
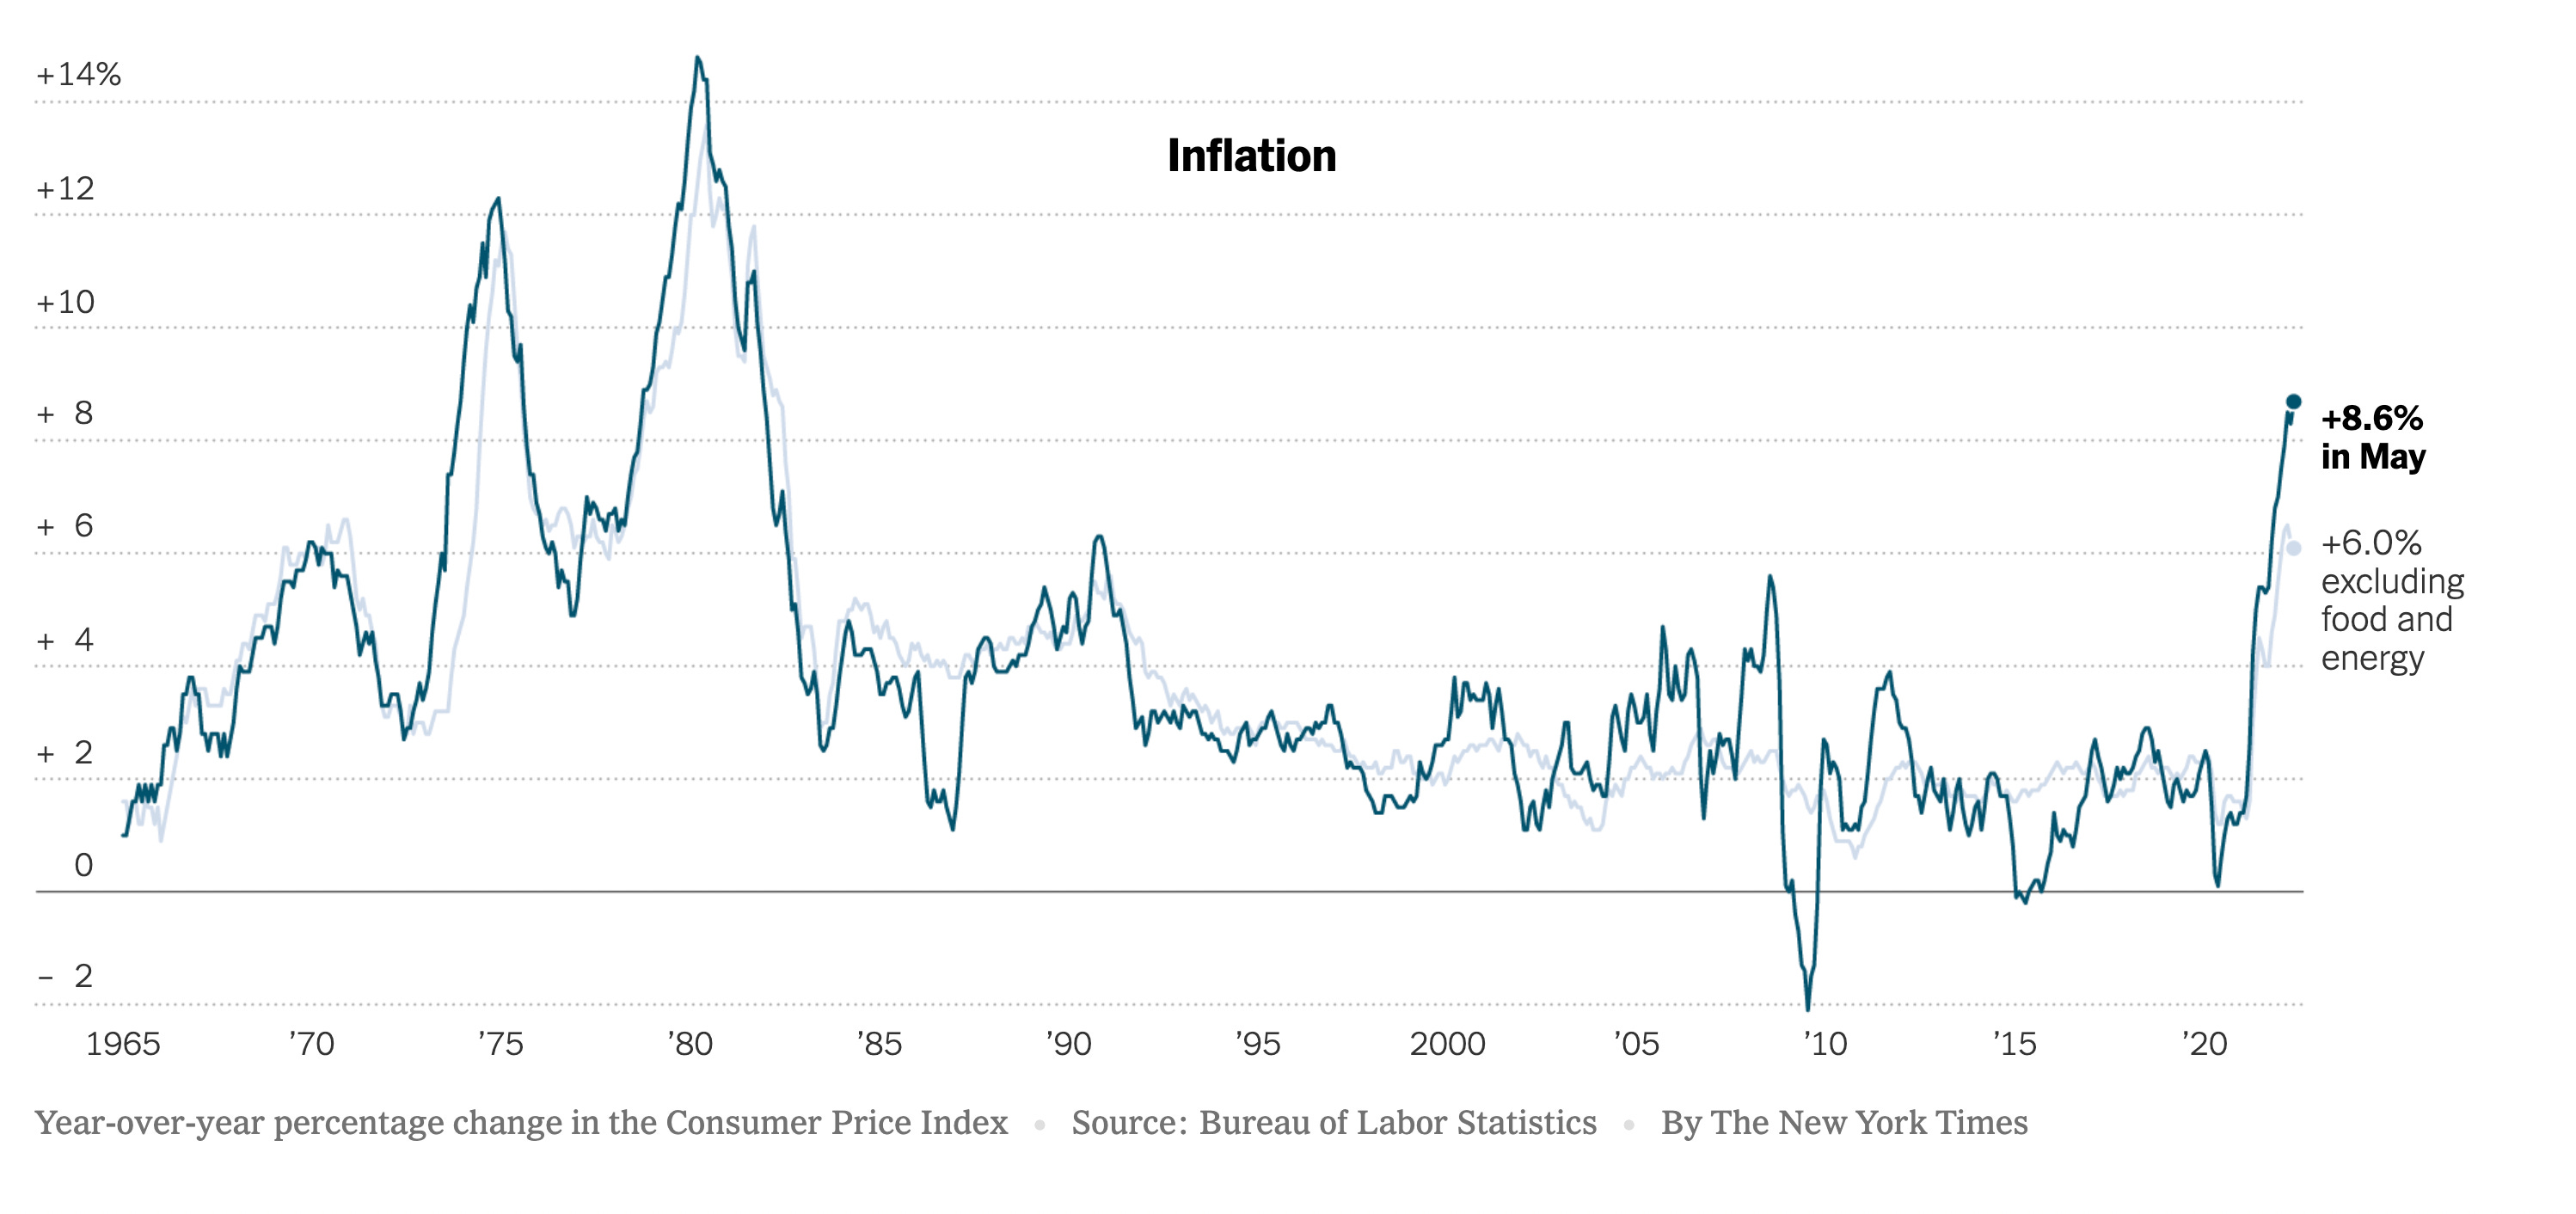
CPI print came in hot yesterday at 8.6%. Highest since 1981. This came as a surprise to many investors and operators. Expectations were closer to 8.2%.
The unemployment report was fairly positive. The U.S. added 390,000 new jobs – keeping the unemployment rate at 3.6%.
As we’ve discussed in the past, the Fed has two jobs:
- Achieve maximum employment
- Achieve price stability
Number 1 feels achieved given the strength of the labor market, but number 2 is a problem.
Inflation Data
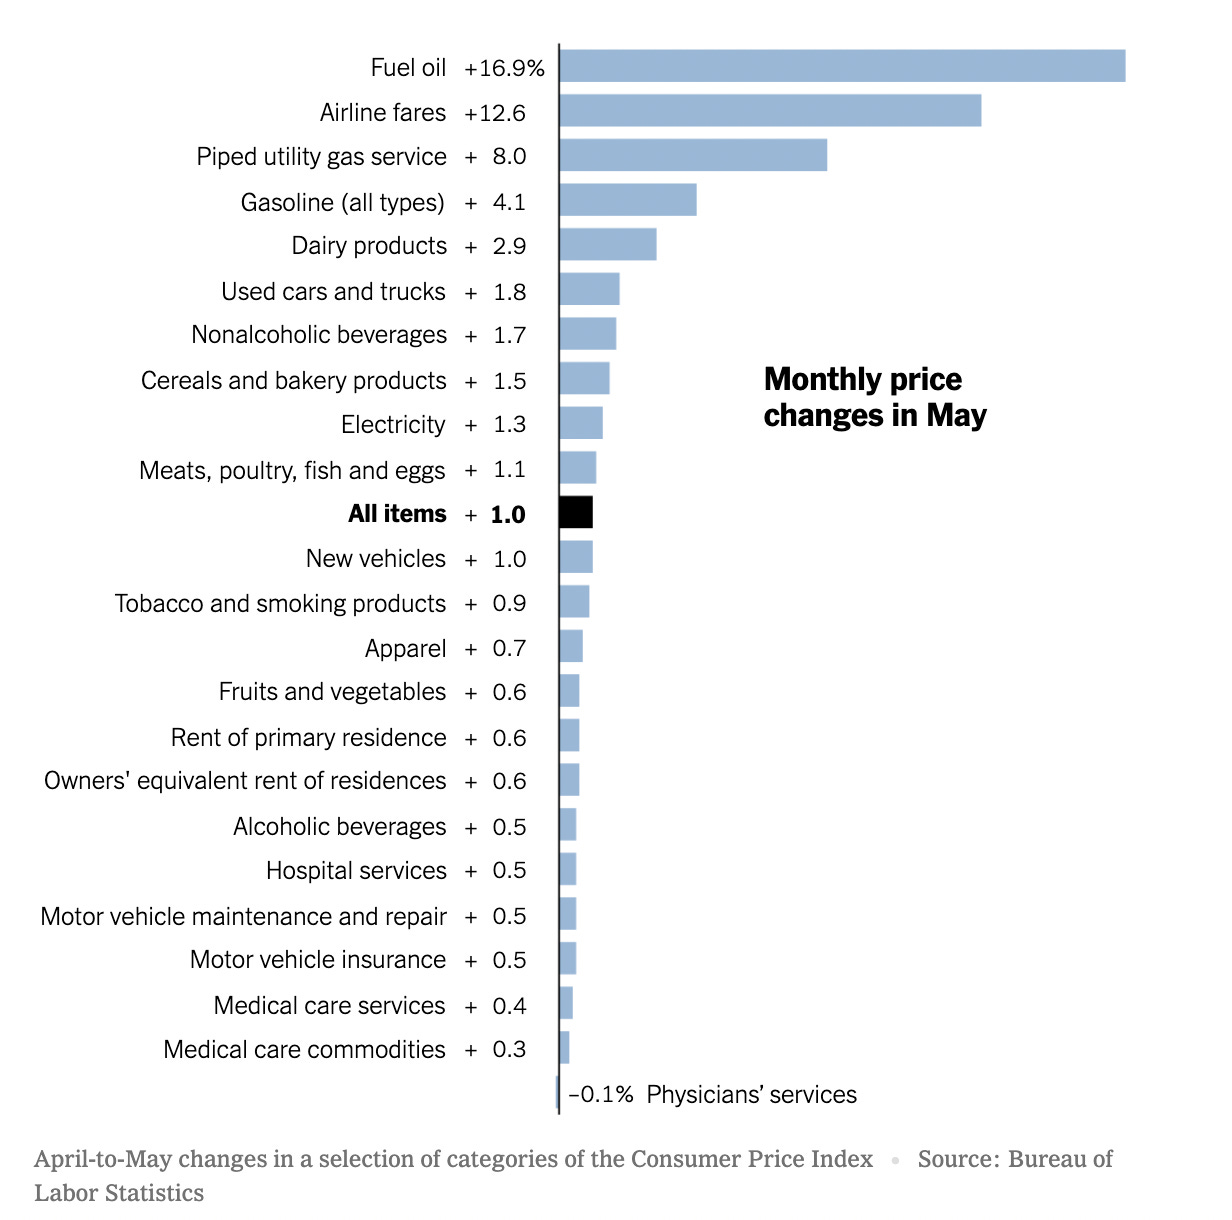
To no one’s surprise, energy was a key driver. Average price per gallon has reached $5 (highest ever in the US). Other key changes from April to May:
Best way to predict the future is to study history. But history is not perspective to future events. It is directional.
Looking at the chart above, it’s interesting to see the seesaw inflation data between 1970-1985. Tough 15 years.
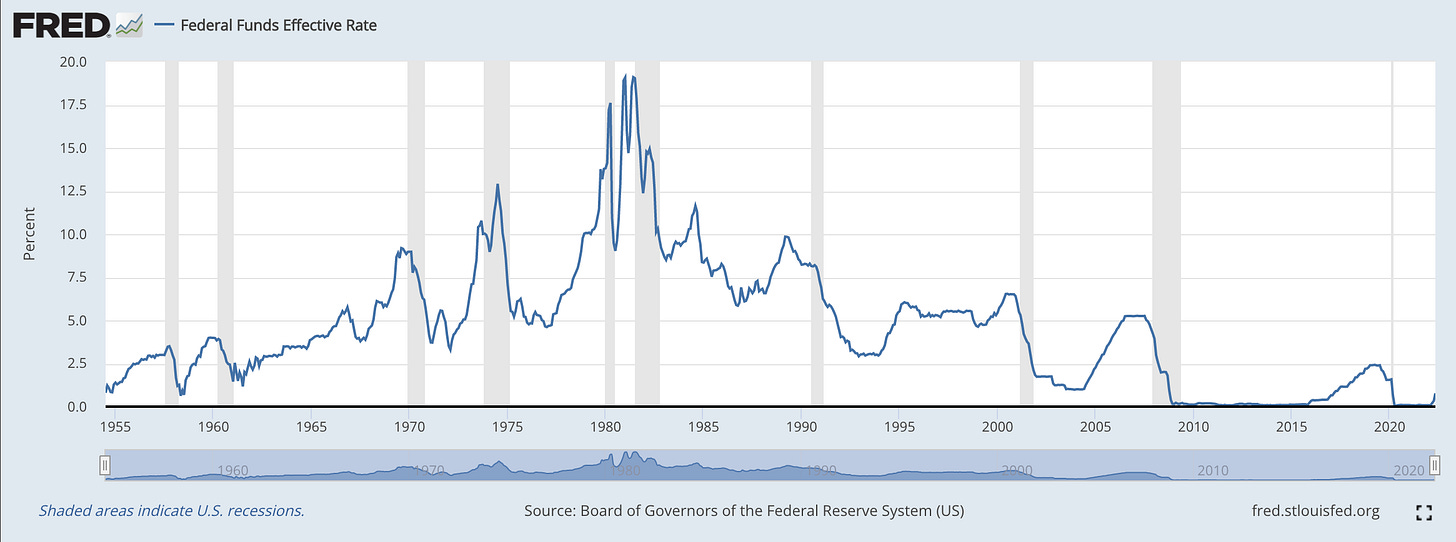
History of Fed Funds Rate
Paul Volcker and his administration had to be extremely aggressive with interest rate hikes and monetary policy to combat inflation.
Here’s a quick look Fed Funds rate dating back to 1955. We’re mainly curious about the era of 1970-1990.
Last year, I wrote two short essays on The History of Interest Rates and Inflation On The Horizon, where I captured notes on spike in liquidity and it’s on capital markets.
We’ve been living in the lowest interest rate environment in history for the last 10 years. Coming out of 08-09 Global Financial Crises, the Fed had no choice but to reduce cost of capital. It seems, however, that party might be over.
The best way Fed combatted high inflation in 1980s was to increase Fed Funds Rate above the CPI. Doing that today on top of quantitative tightening will be a roller coaster ride for investors and operators alike.
Things To Keep An Eye On
FOMC meeting schedule
Next meeting is June 15-16. Followed by July 27-28. Expectations are that rates will increase by 50 bps in each of those meetings. It shouldn’t be surprising for them to change-course and do a 75 bps hike in July. Currently they plan to pause a rate hike in September. TBD if that will stay true given latest CPI print.
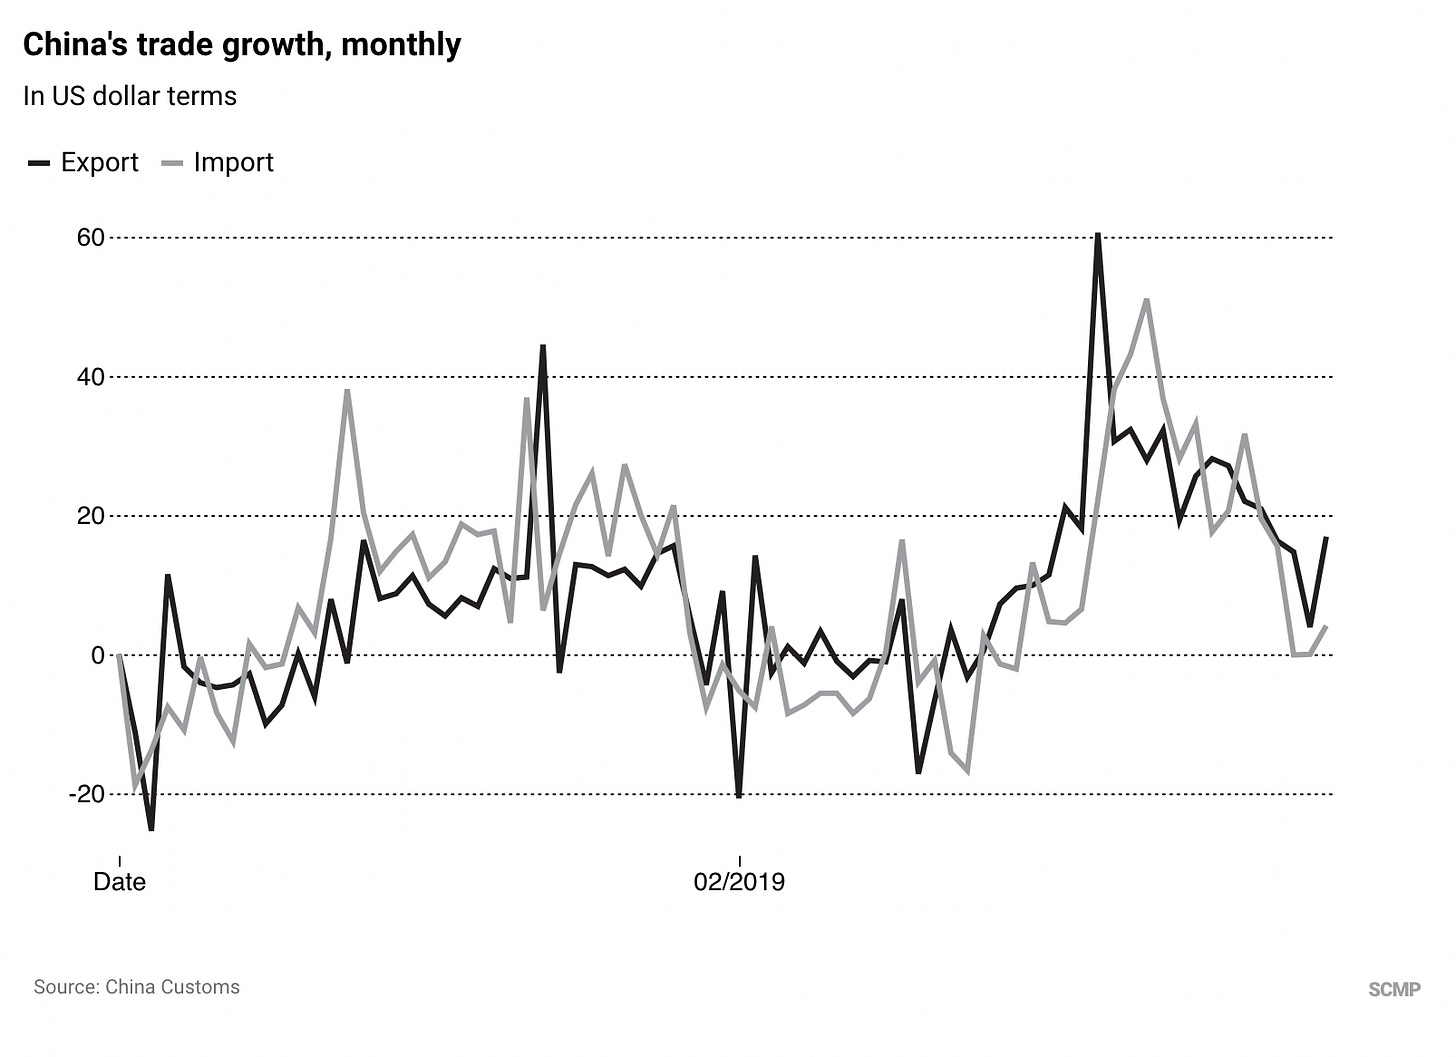
China’s re-opening
Will it provide a relief in some of the supply-side dynamics? A good chart to review is their monthly import/export data.
Oil supply remaining tight.
Energy is probably the only sector for investors that’s driving yield. It’s also the major source of month-over-month inflation increase.
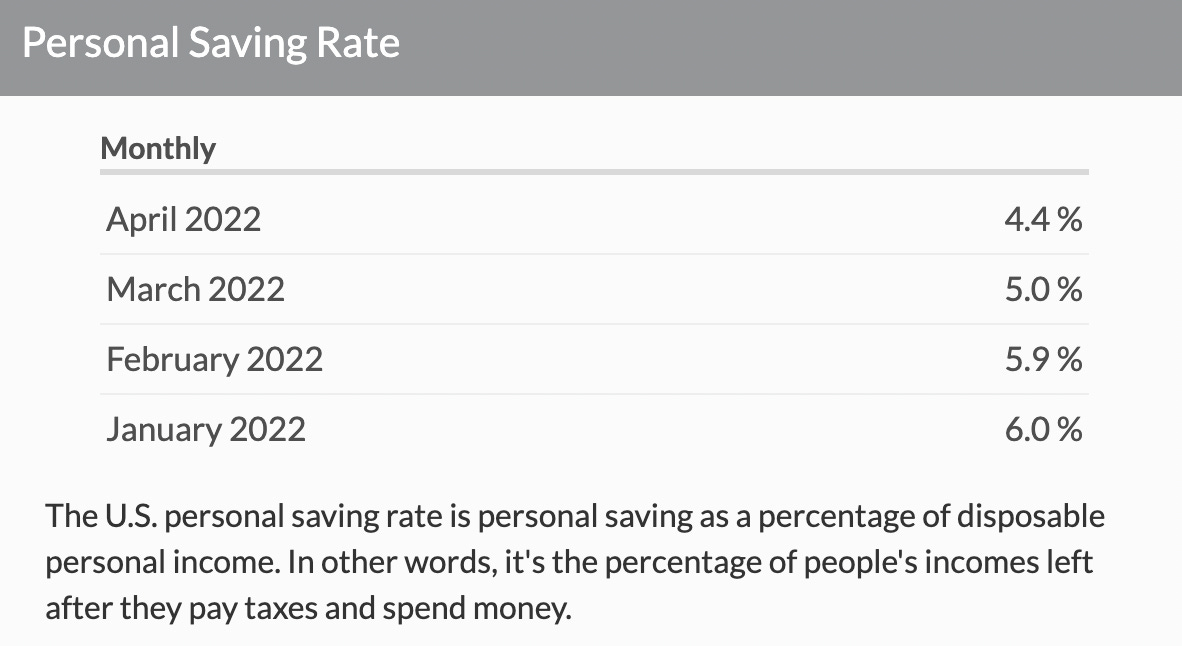
Personal savings rate.
It’s dropping. High consumption today means lower consumption in the future. This can also lead to a consumer credit issue.
We captured a lot of these notes in the latest pod, so if you prefer an audio version, that will be live this weekend.